Beyond the Scoreline: Using xG to Predict the Next Big 'Over' and 'Under' Bets
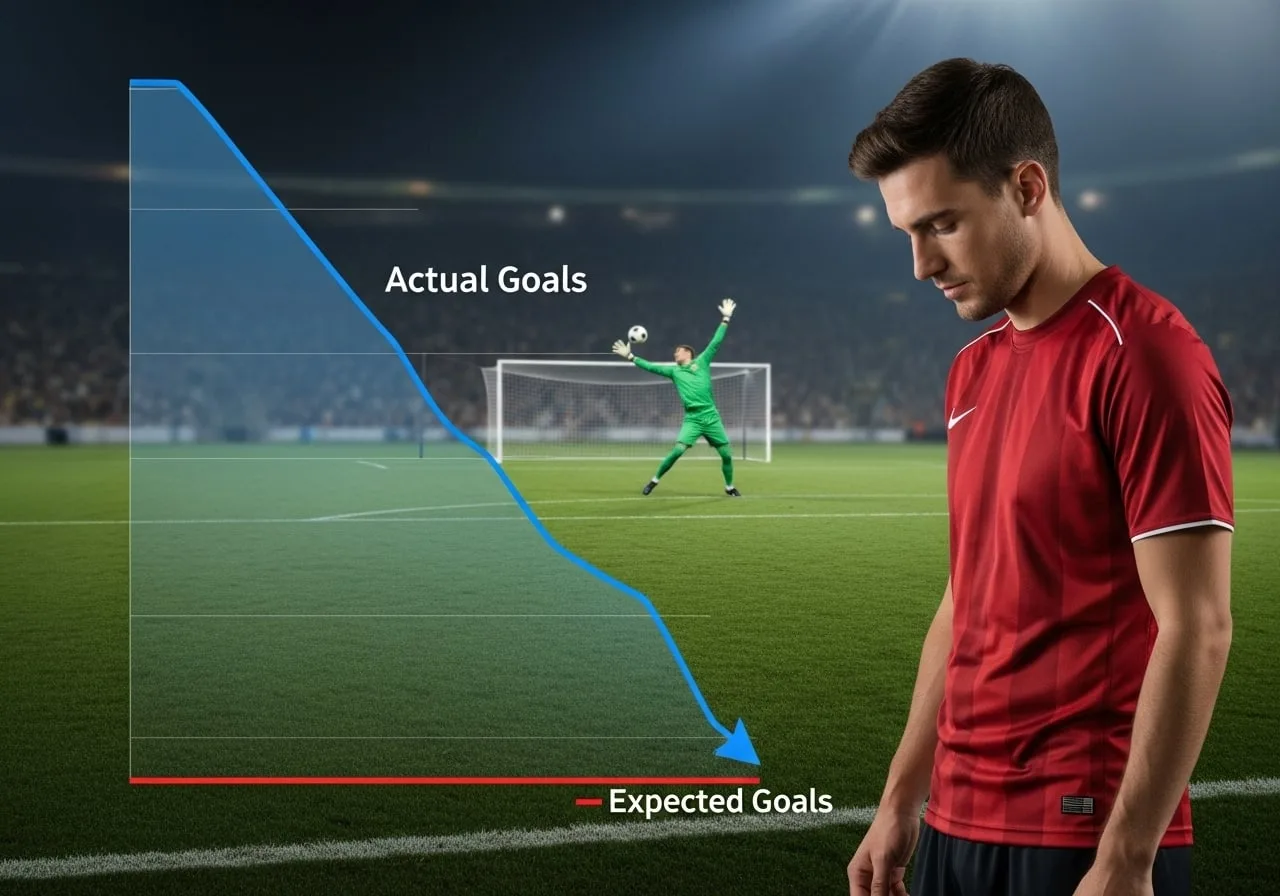

The final score in football is often an accident, an outcome heavily influenced by moments of goalkeeping brilliance or poor finishing. A 1-0 win achieved with an Expected Goals (xG) value of just 0.5 is, statistically speaking, a lucky result. Conversely, a 0-0 draw where a team registers 3.0 xG is nothing but a frustrating anomaly. This is why the analytical edge lies in ignoring the scoreline and measuring the quality of chances created. xG assigns a probability (0-1) to every shot, revealing how many goals a team should have scored. The key to successful prediction in the Over/Under markets is finding the divergence between a team's Actual Goals (A) and their Expected Goals (xG), anticipating that all teams will eventually experience a regression to the mean. This EZ Tips data-driven perspective removes emotion, providing a solid foundation for finding value where the betting market is still fooled by short-term variance. That same variance-versus-quality concept shows up in basketball totals too, and this basketball points predictions guide explains how pace, shot volume, and efficiency help you judge when scoring lines drift away from the real game script.
The Underperformance Edge: Finding the 'Over' Value
The most profitable predictions come from identifying the xG Underachiever—the team with Actual Goals (A) significantly lower than their Expected Goals (xG). These aren't teams playing badly; they're simply on a run of poor finishing or bad luck. They hit the post, opponents' keepers have career days, or a few marginal calls go against them. But the quality of their chances remains high, which is the authoritative signal that matters. Over a larger number of fixtures, this gap will inevitably close. The team is due for a goal surge as their strikers start converting their high-probability chances at a normal rate. This dynamic makes their upcoming matches prime targets for the Over 2.5/3.5 Goals market. This strategy is about being patient and backing the underlying quality of the attack, confident that the statistics underpin a coming wave of positive results. If you’re looking for a totals market that reacts more smoothly to these statistical swings, the Over 1.75 goals meaning guide explains how this flexible line can protect your stake while still capturing upcoming goal surges. For example, a club with 15 goals from 22.0 xG is a ticking time bomb ready to explode into scoring form. Tracking these finishing gaps across a full league season is especially useful in individual markets like the Scottish Premiership top scorer race, where sustained xG overperformance often separates contenders from true goal leaders — see the full breakdown here: Scootish Premiership Top Scorer
The Overperformance Warning: Spotting the 'Under' Value
For a truly balanced prediction strategy, you must also recognize when success is unsustainable. This is the case with the xG Overachiever—a team with Actual Goals (A) well above their Expected Goals (xG). These teams are enjoying a temporary period of hyper-clinical finishing, converting low-probability shots that simply won't go in over the long term. This lucky streak is due for a correction, and their goal tally is likely to decrease dramatically as variance balances out. This pattern is often accompanied by an equally poor defensive metric, the xGA (Expected Goals Against), which shows their keeper is making an unrepeatable number of world-class saves. When you identify this profile, you should target their games for the Under 2.5 Goals market. For fixtures where defensive regression still allows multiple scoring phases without extreme volatility, understanding the under 4.5 goals meaning helps bettors assess matches that remain structurally low-risk even if goals arrive in clusters. This personal and disciplined approach helps you avoid overvaluing a team based on misleading scorelines, instead focusing on the quality of chances they are genuinely creating and conceding.To explore how professional bettors capitalize on these low-scoring trends, check out our detailed guide on the Under 2.5 Goals betting strategy and learn how to identify true defensive value
The Defensive Application: Expected Goals Against (xGA)
A truly balanced prediction requires looking at both sides of the ball. This is where Expected Goals Against (xGA) comes in.  measures the quality of chances a team concedes. By comparing to Actual Goals Conceded (A-Con), you identify whether a defense is genuinely strong or just benefiting from luck or a world-class goalkeeper performance.
- Due for a Defensive Slump (A-Con < xGA ): A team that has conceded fewer goals than their indicates is highly vulnerable. Their goalkeeper is making unsustainable saves, or their opponents are having a run of poor finishing. This trend will not hold. Their upcoming matches are prime for the Over 2.5 Goals market, as their defense is due to regress and concede what the data says they should. You should also bet Over on their next opponent’s total goals.
- Due for Defensive Improvement (A-Con > xGA): A team that has conceded more goals than their suggests has been unlucky. They are facing opponents who are converting low-probability shots, or they've had a few unfortunate deflections. This side is authoritative in defense but has been penalised by bad fortune. Bet Under on their opponents’ total goals, as the underlying metrics show they rarely offer high-quality chances. This perspective allows you to target defensive value even if recent scorelines look shaky.
Spotting 'Fake Form': The xG Divergence Strategy
At Eztips, we don't just look at the last five results; we look at the "soul" of those matches. In 2026, the betting markets are faster than ever, often overreacting to a team that wins three games in a row. This is where you find a unique edge by identifying "Fake Form."
The "Paper Tiger" Defense If a team has kept three clean sheets but their xGA (Expected Goals Against) was 4.8, they aren't "defensively solid"—they are lucky. Their goalkeeper is likely performing at an unsustainable level (saving +2.0 more goals than the average).
- The Play: As soon as that team faces a "Clinical Finisher" (a striker overperforming their xG), the regression hits. This is the perfect time to bet Over 2.5 Goals even if the public is backing another "Under."
The "Bottleneck" Attack Conversely, if a top-tier side like Manchester City or Real Madrid has only scored 2 goals in 3 games despite an xG of 8.5, the public will start to fade them. Eztips data suggests this is the utmost time to "Buy Low." A team creating that many high-quality chances is a "ticking time bomb" for a 4-0 or 5-0 blowout.
Capitalizing on Regression with Betting Offers
The betting market is reactionary. When a team has two or three "lucky" low-scoring games, the best betting sites often drop the odds for the "Under" and inflate the price for the "Over." At Eztips, we look for this specific divergence to strike.
Because xG analysis is a "long game" strategy, using the right betting offers can significantly lower your risk while waiting for the math to normalize.
- Early Payout Specials: If you back an "xG Underachiever" to finally find their form, seek out sites with early payout triggers. If your team goes 2-0 up because their finishing finally matches their chance creation, your bet is secured regardless of a late-game collapse.
- Acca Insurance: xG models are perfect for "Over 1.5" parlays. By combining 3 or 4 teams with high xG/Actual Goal gaps, you create a high-probability ticket. Eztips recommends using platforms that offer insurance, so if one "lucky" goalkeeper ruins your parlay, your stake is protected.
Play the Long Game
xG analysis is a personal, authoritative, and balanced approach that transforms standard match predictions into a detailed study of football's true performance. By integrating the and metrics, you move beyond being a victim of short-term variance and position yourself as a calculated observer. This methodology removes the emotion attached to a lucky 1-0 win or a frustrating 0-0 draw, providing the solid, statistical basis needed to successfully target the mispriced bets in the Over/Under markets. For those following real-time betting trends and live basketball data, explore our live NBL NZ scores to analyze momentum shifts and scoring dynamics across ongoing matches. Be patient—regression to the mean is not a single-game guarantee, but over the long run, backing the underlying quality is the key to unlocking consistent value.
Frequently Asked Questions
Football Blogs

BetMatch Casino Review: Games, Bonuses & Player Experience
. 22 Sept 2025

Bitcasino.io Review 2025: Is This Crypto Casino Still a Top Pick?
. 22 Sept 2025

Stake.com Review: The Ultimate Crypto Casino & Sportsbook
. 22 Sept 2025

Correct Score 0-0 Prediction Today: Expert Analysis
. 24 Sept 2025